Donning yellow and orange safety vests, Explorers set out to collect their first results for their water quality monitoring project of Green Mill Run. Explorers were divided into three groups. Each group was given a list of items they were to sample or measure along with directions and supplies. (Ex: Orange Group tested for coliform and measured channel area, velocity and temperature. Blue Group tested for dissolved oxygen, pH, and turbidity. Green Group tested for nitrates, phosphates and biochemical oxygen demand.) Each month the groups will rotate lists so that they can experience sampling and measuring of each item.
Below are the results.
Below are the results.
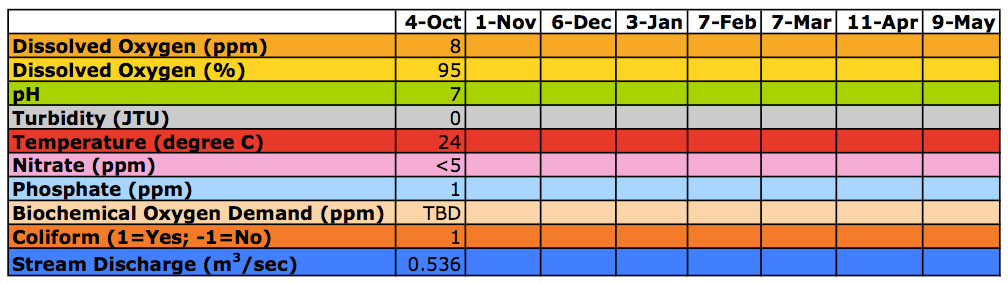
Each month we will update the above table. The Biochemical Oxygen Demand test takes 5 days to determine the results. We will post its measurement in next month's update on water quality monitoring.
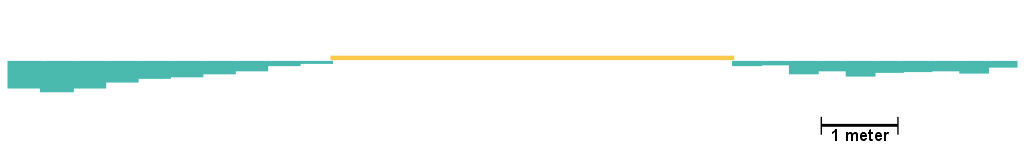
The diagram below shows the stream bed topography. The channel where we are sampling is divided in two by a large sandbar. The blue/green area denotes the area of the channel. The yellow area denotes the sandbar.
The diagram below shows the stream bed topography. The channel where we are sampling is divided in two by a large sandbar. The blue/green area denotes the area of the channel. The yellow area denotes the sandbar.
While not all Explorers got their feet wet on this excursion, there will be ample opportunities over the year to get their feet wet. They were introduced to all sorts of new equipment which they will be introducing in future posts.
References:
 RSS Feed

